Average Torque of a Car: Understanding Range, Curves, and Real-World Performance
Explore what the term 'average torque' really means for cars, how torque varies by engine, gearing, and drivetrain, and how to read torque data for buying, tuning, or daily driving. A data-driven guide by Easy Torque.

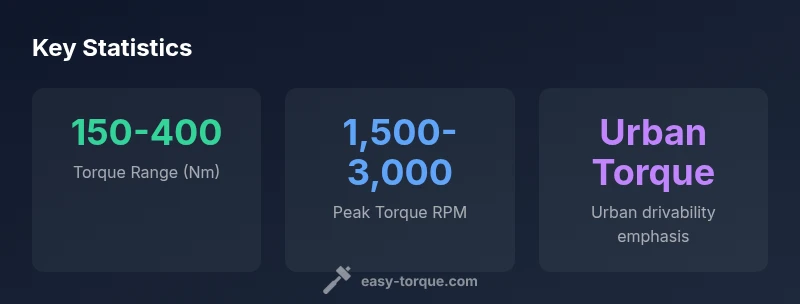
The average torque of a car is not a single fixed value; it depends on engine size, design, and gearing. For most passenger cars, practical torque ranges roughly from 150 to 400 Nm, with higher-performance engines and hybrids on the upper end. Torque varies with RPM, final drive ratios, and drivetrain losses, so real-world delivery differs from published peak figures.
What torque means in everyday driving
Torque is the twisting force that powers your car’s acceleration. When people ask about the "average torque of a car," they are often chasing a single, universal number. The truth is torque is not a standalone spec; it reflects engine size, design decisions, and how the power is routed to the wheels. The phrase "average torque" is a simplification used for high-level comparisons across models. In practice, torque varies across RPM, and the way a car delivers that torque—through its transmission and final drive—shapes how the vehicle feels on the road. According to Easy Torque, the most meaningful way to think about torque is in the context of the engine’s torque curve: the range of RPM over which the engine can produce usable torque, and how that torque is routed via the drivetrain. This perspective helps explain why two cars with similar peak torque can feel very different during normal driving. For a practical takeaway, focus on the torque curve across RPM rather than a single peak figure, and consider how the car’s gearing will use that torque in everyday situations, such as city acceleration and highway overtaking.
How torque is measured and reported
Torque data is usually published in Newton-meters (Nm) or pound-feet (lb-ft). Manufacturers commonly report peak torque at a specific engine RPM, along with horsepower and redline. However, that peak torque figure is a snapshot, not a guarantee of how the car will feel across all speeds. Real-world torque is affected by air intake, temperature, altitude, and engine wear, as well as by the drivetrain losses inside the transmission, driveshaft, and differential. When comparing cars, look for multiple data points: peak torque, torque at various RPM bands, and the shape of the torque curve. Nm is the standard metric in most regions, while some markets still reference lb-ft. For readers in the United States or other markets, converting units can help with side-by-side comparisons. In every case, the torque curve matters more for drivability than a single number, and real-world performance should be considered alongside horsepower, weight, and gearing.
The torque curve and engine performance
The torque curve illustrates how much torque the engine can deliver at different RPM. Low-end torque (near the idle range) helps with immediate response and city driving, while mid-range torque improves acceleration in most everyday scenarios. High-end torque often drops as RPM climbs toward redline, especially in naturally aspirated engines, but turbocharged or diesel designs can extend usable torque into higher RPMs. A strong low- to mid-range torque curve means quicker initial acceleration and less need for frequent gear changes, particularly in manual transmissions. Conversely, a peak torque figure at high RPM may not translate to brisk everyday performance if the engine must rev aggressively to reach that peak. Understanding the curve helps you anticipate how a vehicle will feel when merging, overtaking, or climbing grades. It also clarifies why two cars with similar peak torque can feel very different on the road, depending on where that torque peak occurs along the RPM band.
Real-world factors that shape usable torque
Real-world torque is not just a function of engine displacement. Transmission type (manual, automatic, CVT, or dual-clutch) and its gear ratios determine how quickly the engine’s peak torque translates into wheel torque. Final drive ratios tune how torque multiplies at the wheels, influencing acceleration and hill-climbing ability. Vehicle weight, tire size, and aerodynamics further affect perceived torque because heavier cars or larger tires require more torque to achieve the same acceleration. Drive modes, engine management, and turbo lag (in forced-induction engines) also alter when torque is delivered. A lighter car with a tall final drive may feel peppy in city traffic, while a heavier vehicle with more gears could feel sluggish at low RPMs but strong at higher speeds. In short, the same engine can feel very different when installed in different drivetrains and with different tire setups.
How manufacturers present torque data and what to trust
Automakers often publish peak torque, torque at particular RPMs, and the torque curve for modern engines. The most trustworthy comparisons combine multiple measures: peak torque, torque at several RPM points, and the overall shape of the curve. Be wary of marketing-only figures that emphasize a high peak torque without showing where that peak occurs or how sustainable the torque is across RPM. When evaluating used cars, request the torque curve or third-party test data to understand actual in-vehicle performance. The best sources reveal torque delivery across RPM bands, rather than a single highlight, enabling a more accurate assessment of daily drivability. In all cases, interpret torque alongside horsepower, weight, and gearing to obtain a complete picture of real-world performance.
Practical implications: reading torque info for buying and tuning
For buyers and tuners, torque data informs both everyday usability and performance goals. Start by identifying your typical driving range—city, highway, or mixed—and examine the torque curve within that band. A car with strong low-end torque is generally more enjoyable in city traffic and requires fewer gear changes. For tuning enthusiasts, a steeper torque curve at lower RPMs can improve response, but be mindful of exhaust back-pressure, intake efficiency, and transmission constraints. When comparing engines, normalize torque by displacement to gauge efficiency, and consider the whole package: weight, aerodynamics, and gearing. Finally, remember that even a robust torque figure can be hampered by poor traction or tire choice, so evaluate the complete drivetrain and chassis context.
Quick reference: translating torque data to real-world feel
- Focus on torque curves rather than a single peak number
- Consider RPM bands where torque is available for your typical driving style
- Match gearing and tires to maximize usable torque
- Compare torque per liter to assess efficiency, not just raw torque
- Use torque data with horsepower and weight to estimate acceleration and fuel economy
Torque data myths debunked
A common myth is that higher peak torque always means faster acceleration. In reality, the car’s gearbox, tire grip, and curb weight determine how effectively that torque translates into speed. Another misconception is that torque alone dictates fuel economy; engine efficiency and drivetrain losses, along with driving behavior, play substantial roles. Finally, some marketing materials exaggerate torque in a way that omits the RPM at which that torque occurs. The best practice is to examine the full torque curve, test drive with intent, and use data from credible test facilities or the manufacturer’s published figures.
Table: Key torque concepts and what they mean for performance
| Aspect | Definition | Notes |
|---|---|---|
| Definition of average torque | Torque varies by engine and gearing | Represents an overall sense of availability across RPM |
| Peak torque vs usable torque | Peak torque is a single point; usable torque is available across RPM bands | Useful for real-world drivability assessment |
| Measurement units | Nm (or lb‑ft in some markets) | Look for torque curves across RPM for context |
| Influencing factors | Engine design, turbocharging, transmission, weight, tires | No universal single value applies to all cars |
Your Questions Answered
What is the 'average torque' of a car?
There is no single figure that fits all cars. Average torque varies with engine size, design, and gearing, and it can be meaningfully represented as a range (for most passenger cars, roughly 150–400 Nm). Look at torque curves to understand how torque is delivered across RPM.
There isn’t one number—torque depends on the engine and gearing, so check the curve for real-world drivability.
How is torque different from horsepower?
Torque measures twisting force, while horsepower combines torque with engine speed to reflect overall power output. Torque is most felt at lower speeds, horsepower becomes more relevant as speed rises. Both figures, interpreted together, predict acceleration and efficiency.
Torque is the twist you feel early on; horsepower is about power as speed climbs.
Why do engines have different torque curves?
Torque curves vary because engines are tuned for different goals—fuel efficiency, emissions, response, or top speed. Turbochargers, turbo lag, and intake design shift peak torque to different RPM ranges, affecting everyday feel.
Engine tuning and turbo setup shift when torque peak happens, changing everyday feel.
What should I trust when comparing torque data?
Trust data that shows torque across multiple RPM points or a full curve, not just a single peak. Prefer independent tests or manufacturer curves that map performance in realistic conditions.
Look for complete torque curves, not just one peak number.
Can I estimate 0–60 times from torque data?
Torque helps estimate acceleration, but 0–60 depends on many factors: weight, aerodynamics, drivetrain, and tires. Use torque curves in combination with weight and power to get a better sense of acceleration potential.
Torque helps estimate speed, but you’ll need the whole package to guess 0–60.
“Torque curves reveal that real-world performance hinges on more than peak figures; the transmission, gearing, and RPM window shape how torque feels in daily driving.”
Top Takeaways
- Read torque data as a curve, not a single peak
- Identify your typical RPM range and match it to torque delivery
- Consider drivetrain and tire factors that influence usable torque
- Use torque alongside horsepower and weight for acceleration estimates
- Prefer sources that show torque across RPM bands and multiple operating conditions