Torque vs Power: A Practical Comparison
An analytical, practical comparison of torque versus power, explaining definitions, units, and how to read curves for engines, motors, and DIY projects. Learn how to interpret specs and apply this knowledge to real-world tasks.

Torque versus power describe different aspects of rotational systems. Torque is the twisting force, while power is the rate at which work is done. In most machines, they are linked by angular speed: P = τ ω. Understanding this relationship helps explain device performance and guide component choices for practical applications across engines, drills, and conveyors.
Core Concepts: Torque and Power in Context
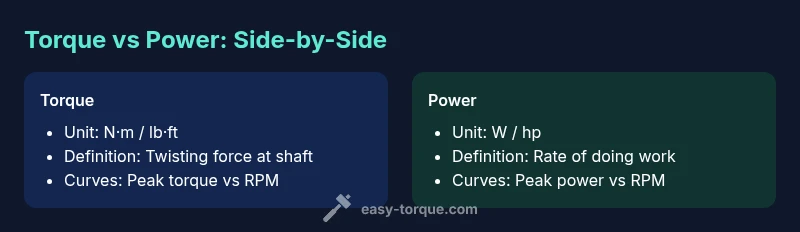
Torque measures the twisting or turning force a component can apply, typically described in newton-meters (N·m) or pound-force feet (lbf·ft). Power is the rate at which work is done, expressed in watts (W) or horsepower (hp). In mechanical systems, you rarely encounter torque or power in isolation; their values matter relative to rotational speed. According to Easy Torque, the practical takeaway is that torque defines the potential to do work at a given instant, but power tells you how quickly that work can be performed as the shaft spins. This distinction matters across engines, drills, or winches: a tool could deliver high torque at low speed, or high speed with modest torque, and the performance outcome depends on the operating regime.
Torque is a moment of force: a force applied at some distance from the axis produces rotation. The farther the force is applied, the greater the torque for a given force. Power, by contrast, is a rate; it describes energy per unit time. In rotating systems, energy transfer occurs through angular motion, so both torque and speed determine energy delivery. When engineers design a motor or engine, they map torque curves (torque versus RPM) and power curves (power versus RPM) to visualize how the device performs under different loads. The interplay is central to performance, efficiency, and control. For DIY enthusiasts, this means that two devices with similar peak torque can feel very different if one reaches its peak torque at a higher speed or under different stall conditions.
The Math Behind Torque and Power
The defining equation for rotational power is P = τ × ω, where P is power in watts, τ is torque in newton-meters, and ω is angular velocity in radians per second. To relate rpm to ω, use ω = 2π × rpm / 60. This means you can convert engine speed into a rotational energy rate if you know the operative torque. For example, if a shaft experiences 250 N·m of torque while spinning at 3000 rpm, ω ≈ 2π × 3000 / 60 ≈ 314.16 rad/s, and P ≈ 250 × 314.16 ≈ 78,540 W, which is about 105.3 horsepower (using 1 hp ≈ 746 W). This illustrates why high-torque devices can deliver substantial power only when they also rotate quickly enough.
Power and torque have inverse relationships with speed in many real systems due to design limits and efficiency. At very low speeds, torque can be high but power is modest; at very high speeds, power can be very large because ω multiplies torque even if τ falls. Understanding these tradeoffs helps you compare motors, engines, and tools across operating ranges, rather than judging them by a single peak value.
torque versus power: Reading the Curves
Most manufacturers present torque curves and power curves as functions of RPM. A device may reach peak torque at a lower RPM, but peak horsepower typically occurs at higher RPM. The peak torque indicates the ability to start moving heavy loads or accelerate from low speed, while peak power describes top speed and sustained high-speed performance. In practice, you should examine the range of RPM at which useful torque is available and how quickly power rises with speed. When comparing two devices, prefer the one with a flatter torque curve over the critical operating band, or the one whose power curve remains high through the RPM range of your task. Remember that real equipment includes inefficiencies, so the effective torque and power will be a bit lower than the nominal numbers. This is why dyno testing or real-world trials can be more informative than nominal specs alone.
Measuring and Interpreting Torque and Power in Real Devices
In practice, torque is measured with torque sensors or torque transducers on rotating shafts; power is inferred from torque and speed or measured with a dynamometer (dyno). When you read engine datasheets or motor specs, look for torque at several RPM points and the resulting power. A key concept for DIY projects is the torque curve: if you operate in a region where torque is high, you will feel strong acceleration even if the nominal peak power occurs elsewhere. Additionally, remember efficiency: not all input energy becomes useful torque. Losses in gears, bearings, and electrical systems reduce the effective power available at the shaft. For a hobbyist, it helps to test under your expected load to confirm that the tool or motor delivers adequate torque at the RPM you require. The Easy Torque team emphasizes validating specs with real-world testing rather than relying solely on published peak numbers.
How Systems Use Torque and Power in Practice
Rotating systems harness torque and power differently depending on the task. In automotive engines, torque is crucial for initial acceleration and pulling power, while power governs top speed and sustained performance at high RPMs. In electric motors for tools, torque is often the driver of startup performance, whereas high-speed operation enables faster operation or production rates. In gear-train design, engineers trade torque at the output for speed at the input, using gear ratios to optimize the balance for the intended job. For example, a winch or a long-reach drill needs high low-end torque to overcome inertia, but a conveyor belt may require modest torque at high speed. The perception of performance often depends on how torque at a given RPM translates into actual work over time, i.e., how energy is delivered during operation.
Common Misconceptions to Avoid
A frequent misunderstanding is treating torque and power as interchangeable performance metrics. They are related but describe different things; high torque does not automatically mean high power unless speed is considered. Another pitfall is judging devices by peak numbers without considering the operating range. Real-world performance depends on torque at the RPM where you use the tool or engine. Efficiency losses further complicate the picture, so nominal specs can overstate usable output. Finally, the idea that horsepower alone suffices for choosing a device ignores the critical role of torque in starting or loading conditions. Your best guide is a complete torque and power curve across the expected RPM range.
Practical Guidelines for DIYers
When evaluating tools or engines, start by identifying your typical operating RPM and the load you expect. Look for devices with high usable torque in that band and check how quickly power rises with speed. If you need strong initial acceleration, prioritize a robust torque rating at or near the lower end of the operating range. For high-speed tasks, seek substantial peak power and a sustained power band. Always read the entire curve, not just peak values, and consider system efficiency and losses in gears, couplings, and drives. If possible, test under real conditions or review dyno or field-test data from trusted sources. The Easy Torque approach is to balance torque and power across the intended workload, rather than chasing a single peak.
Quick Reference Formulas and Conversions
- P(W) = τ(N·m) × ω(rad/s)
- ω = 2π × rpm / 60
- P(hp) = P(W) / 746
- τ = P(W) / ω
- For gears, Power is approximately conserved (minus losses) across stages
- Use consistent units when comparing devices (N·m vs lb·ft; W vs hp)
Real-World Scenarios: Automotive vs Industrial Primaries
In a typical car engine, torque dominates the low-to-mid RPM range, enabling practical starting and hill-climb capability, while power governs acceleration to higher speeds. In industrial motors driving conveyors or pumps, the focus often centers on maintaining usable torque across the required RPM band to avoid stall and ensure smooth operation. Electric drills prioritize high torque at lower RPM to maximize their lugging capability, whereas high-speed spindles emphasize substantial power at elevated RPMs. In both contexts, interpreting the torque curve alongside the power curve provides the clearest view of performance and reliability.
Design Considerations: Tradeoffs and Optimization
Designers face tradeoffs between torque density and speed. A compact motor or engine may struggle to deliver sustained high torque at high RPM due to thermal limits, while oversized systems waste energy at low RPMs. The optimal choice integrates motor topology, gearing, and drive mechanics to ensure torque is available where needed and power is sufficient to reach the desired operating speed. In practice, matching the torque curve to the load profile reduces fuel consumption or energy use and improves responsiveness. For DIYers, the takeaway is to align the hardware’s torque capability with the RPM range and mechanical load of the project.
Putting It All Together: How to Apply This in Your Projects
Effective design or selection starts with identifying your operating band and the required energy delivery over time. Use torque curves to confirm that your device can deliver sufficient torque at the RPM you’ll actually operate. Cross-check with the power curve to ensure you won’t hit a speed bottleneck under peak load. Remember that efficiency losses, temperature, and wear affect real-world performance. By considering both torque and power in tandem, you gain a more accurate forecast of behavior under load and can choose components that meet your goals without overbuilding or underperforming.
Authority Sources
This section provides external references to support the concepts discussed and to offer deeper technical context. Consider reviewing official sources and educational materials for more rigorous treatments of torque, power, and rotational dynamics:
- https://www.energy.gov/
- https://www.nist.gov/
- https://www.nasa.gov/
Comparison
| Feature | Torque | Power |
|---|---|---|
| Definition | Twisting force available at the shaft | Rate of doing work in a rotating system |
| Primary unit | N·m / lb·ft | W / hp |
| Key equation | τ = F × r (and P = τ × ω) | P = τ × ω (or P = F × v) |
| Measurement focus | Instantaneous rotational force | Energy per unit time |
| Typical operating context | High torque at low speed for starting/low-load tasks | High speed or high RPM for high power output |
| Best for | Starting, lugging, or heavy load scenarios | High-speed performance and top-end power |
Pros
- Clarifies how to read device specs by showing both torque and power curves
- Helps identify operating RPM ranges where a device performs best
- Supports better component selection for specific tasks
- Encourages testing under real-world conditions to validate specs
Drawbacks
- Can be confusing if curves are not provided or are poorly labeled
- Misinterpretation arises if efficiency losses are ignored
- Relying on peak numbers without curve context can mislead decisions
- Requires more thorough data review than single-parameter specs
Torque and power are complementary metrics; understand both to optimize real-world performance.
Most tasks benefit from balancing torque and power within the intended operating range. Use complete curves rather than peaks alone, and validate with practical tests. The Easy Torque approach emphasizes integrating both measures for reliable design.
Your Questions Answered
What is the difference between torque and power?
Torque is the twisting force available at the shaft, while power is the rate at which that work is done. Torque matters for starting and lugging, whereas power governs speed and acceleration. In practice, you use both together to understand performance across RPM ranges.
Torque is the twisting force; power tells you how fast that work happens. Look at both when planning your setup.
Why do engines emphasize peak horsepower?
Peak horsepower indicates the maximum rate of work at high RPM, useful for top-end speed and sustained performance. However, engines also rely on torque at lower RPMs to get moving and climb hills, so a balanced graph is more informative than a single peak.
Horsepower shows fast-running capability, but don’t neglect low-speed torque.
How is torque measured in practice?
Torque is measured with torque sensors on a shaft or via a dynamometer. For real-world accuracy, measure at the RPM range where the device operates most often, and account for system losses like gearing and bearings.
We measure torque directly on the shaft or inferred from a dynamometer.
Can a device have high torque and low power?
Yes. At low RPM, a device can produce high torque, but if it can’t spin up, the power rate remains low. The combination of torque and RPM determines the total power delivered.
High torque at low speed isn’t the same as high power; you need speed too.
How do gear ratios affect torque and power?
Gears trade torque for speed. A reduction increases torque at the output while reducing speed, affecting power depending on efficiency. Choose ratios to match the load and desired RPM window.
Gears boost torque or speed depending on what you need.
What should I look for when comparing a drill or motor?
Check torque at the RPM range you’ll use most, and review the speed-torque curve. Look for efficiency data and real-world test results to avoid overestimating performance based on peak numbers.
Read the full curves, not just the peak torque number.
Top Takeaways
- Read both torque and power curves for your operating range
- Prioritize usable torque at the RPM you actually run at
- Don’t judge by peak numbers alone—consider efficiency losses
- Validate specs with real-world testing where possible
- Balance design choices to meet load, speed, and energy goals